
PHET Interactive Simulations: Least-Squares Regression
Free
Topics
Linear Regression
Correlation
Residuals
Outlier
Data
Description
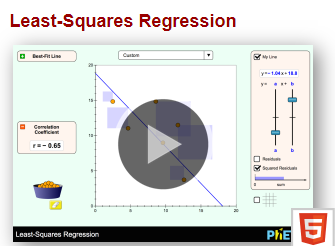
Create your own scatter plot or use real-world data and try to fit a line to it! Explore how individual data points affect the correlation coefficient and best-fit line.
Sample Learning Goals
Interpret r (the correlation coefficient) as data points are added, moved, or removed.
Interpret the sum of the squared residuals while manually fitting a line.
Interpret the sum of the squared residuals of a best-fit line as a data point is added, moved, or removed.
Compare the sum of the squared residuals between a manually fitted line and the best-fit line.
Determine if a linear fit is appropriate.
Language:
English
Curriculum Alignment:
CAPS aligned
Publication Date:
2020-02-13
Audience:
Learners
Teachers
Parents
Type:
Application
Copyright:
PhET Simulations
All simulations available at http://phet.colorado.edu are open educational resources available under the Creative Commons Attribution license (CC-BY).
Permission is granted to freely use, share, or redistribute PhET sims under the CC-BY license. The following attribution is required:
PhET Interactive Simulations
University of Colorado Boulder
https://phet.colorado.edu
If your use includes redistribution of the simulations, please let us know with this form.
https://docs.google.com/forms/d/e/1FAIpQLScJLU-T_z-0BnIEH3TekDdxBdMZ8cKboKNeZ-ftF1vqyn6zcA/viewform

